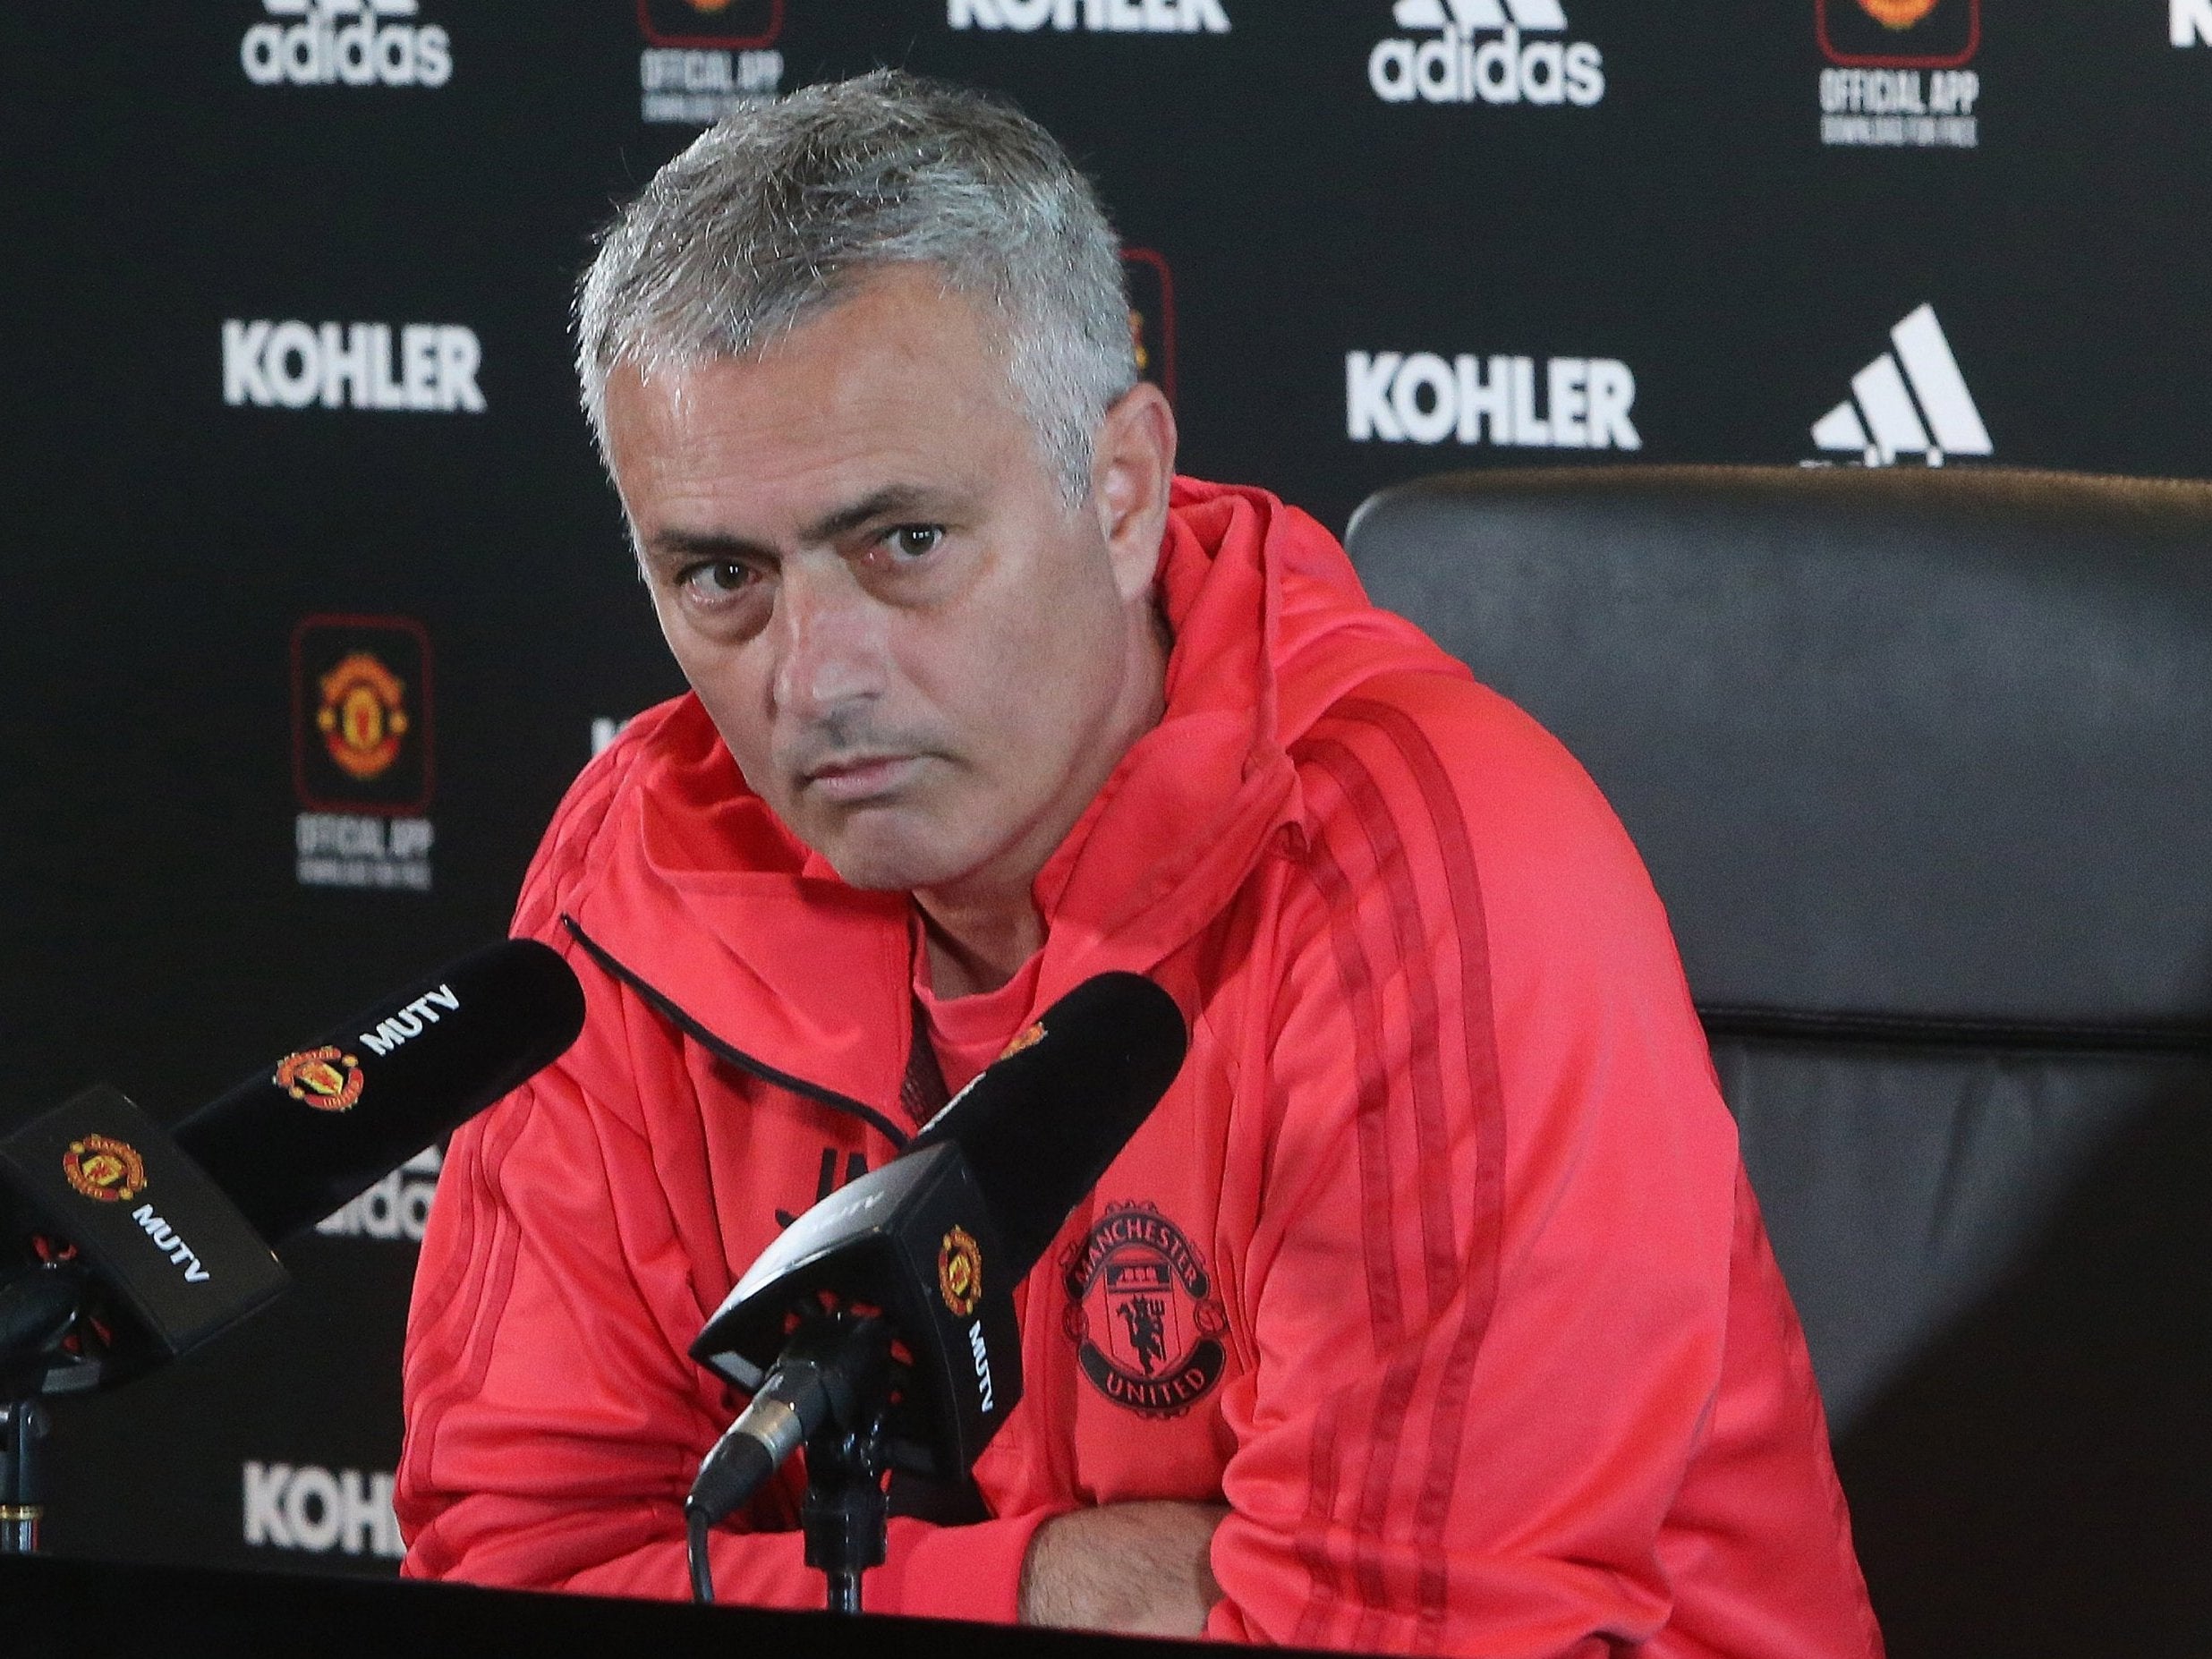
Blogs

Average price of a UK home is now £205,309

Alex Johnson

2ab1827c0bb56b303226f65e56d297441671952e1 150x150 Average price of a UK home is now £205,309Leading UK house price indices reveal that the UK housing market experienced consecutive monthly price rises in the first half of the year, with prices up 4.7% since the end of 2011, claims a new report from property experts Assetz.

The average price of a home is now £205,309, an increase of £9,156 since December, the highest average price recorded by House Price Watch (which is compiled using data from LSL Acadametrics, Nationwide, Halifax, ONS and Rightmove) since June 2008.

Stuart Law, Chief Executive of Assetz, said: “In spite of GDP falling to 0.7% in the second quarter of this year the UK property market appears to be under the influence of far more positive drivers. All of the figures in the latest House Price Watch point to positive annual growth this year with no ‘double dip’ in the forecast. The market is in fact outshining price performance in the first half of 2011 which went on to see price growth of 0.5% for the year as a whole, further dispelling this myth. However, the latest economic figures could still dampen activity in the third quarter.

“Growth of 4.7% for the year to date is reassuring and it looks like the long period of price stability seen since early 2010 could be making way for a strong rise in prices this year. While the figures paint a positive national picture some areas continue to outperform others but this is something consumers are increasingly aware of. Savvy buy to let investors are turning to cities outside of London such as Manchester and Leeds where strong demand and a lack of development has meant gross yields of 8% are typical. These investors will help underpin prices in regional cities this year.

He added that he expected to see annual price growth of 3% in 2012 “comfortably achieved”.

Useful web sites for more information
Property Search Engine
Independent property news
Property for sale in Manchester

Property for sale in Leeds

Property for sale in London

Tagged in: , , ,
  • brit1664

    Stuart you know very well you have selected the traditional spring bounce figures and misrepresenting it to state this is the way the market will go for the rest of the year. You fail to mention the big house price falls we have had this month and the rest of the years monthly figures are usually down off season.

    A few years ago you had the reputation of one of the countries biggest property rampers believed for business purposes. Please don’t start the propaganda campaign again.

    House prices are unsustainably high, they are vastly overvalued being propped up only by record low interest rates. People can’t afford to buy and economic issues will push prices down despite interest rates.

  • Stuartlaw

    Prices are sustainably high, proven by their stability. Demand for a place to live is high proven by rising rents. Prices are up 4.7% so far this year but our forecast remains 3% indicating we think it is quite possible the second half will soften a little but we seem to be seeing the beginning of a new upward trend when you look at the charts.

  • brit1664

    If prices are sustainable then lets raise interest rates to normal levels then, lets get rid of shared ownership/equity and Newbuy scam schemes designed to keep prices inflated.

    We have a huge property bubble primed to pop and burn a lot of people most of all those highly geared buy to let investors. People don’t have the wages, banks don’t have the money to support prices this high.

    Your index uses the widely ridiculed Rightmove figures which is based on initial asking prices for new property not asking prices for all existing property. This adds a vast distortion as people often put inflated asking prices to start off with and are then hit with realism and they are forced to reduce which is not included in the Rightmove figures. Hence the 30% difference between initial asking prices and the far lower selling price.

    I know you are here just to talk up the market for your buy to let customers, just have a little honesty about it.

    I get my understanding about where house prices are going by the powerhouse Austrian School of Economics rather than vested interests.

  • http://twitter.com/majestic_whine majestic whine

    Sustained by the govt throwing everything it can at keeping prices inflated in order that those on the inside can sell in an orderly manner without spooking the market. What will happen to the mug investors left holding property when the rich want to reinvest at realistic prices?

  • nicknuts

    Thank you Stuart for that great news. In fact, the figures I am seeing are showing an overall increase of 10% this year, but get this, in 2020, the average house price will be one million pounds. Whoopeee, way to go. Fantastic news. Mind you, a loaf of bread will cost £33,27p.
    Er, hang on a minute………………

  • tyke87

    This is a lie. The government are desperate to hold up the unrealisticaly high house prices to provide a feel-good factor.

  • 2012willbefun

    I really am not sure what evidence you are using as your reference point for supporting him. One could say the other economies have been wise enough to pop their bubbles to allow the business cycle to work, while we have thrown everything plus the kitchen sink at the leverage/ asset price bubble and, excluding London from the indices, house prices have still fallen and the economy remains weak. Being a mere financial analyst by profession, it would be nice to hear from the experts about what happens to BTL yields when rates do go up (I do not think they will as the economy will remain strained for years, but the analysis above assumes an economic recovery AND no rate rises over the life of this long-run illiquid investment). The opportunity cost of a 30% deposit for investors is an aside. The capital losses outside London mean that BTL works when interest rates are low (not like the “good” old days when it was all about capital growth and using leverage). And I recently read somewhere that the government’s poor financial position means it may start adjusting the interest rate relief BTL get, as it needs additional funding. Now to the Index. I assume in no way weighted and so already irrelevant, but here goes (I just found the latest reports online): LSL Index: whether using the Index that includes or excludes London in their own tables, at BEST, stagnation (nominal terms in all cases) relative to Jan 2010 OR since Jan 2011. ONS Survey: this has many tables at the end and I could pick and choose as he has to make up anything, so I will not bother. But chart 1 on p2 implies falls or stagnation over the same one and two year period I mention from LSL. Halifax Survey: shows volatility but over one year definite stagnation (the latest report only gives June 2011 to June 2012 rather than two years, so it is not an attempt to skew the time period to suit as some do). Nationwide Survey: also shows volatility but stagnation when compared with Jan 2010 (and a small rise against Jan 2011) and so nothing really happening (although this one has had more swings). Rightmove: there is a chart (page 4) going back to July 2011. Eureka, now we know where the “Watch” gets its “surge”. Made up prices that even Rightmove accepts have increasingly diverged from selling prices in recent quarters. I wonder if there is also some magical adjustment that would make Gandalf proud being used in the “Watch”, otherwise it does not seem to match its own underlying components, barring the increasingly odd looking ASKING price index. Perhaps the journalist who commissioned this story should do the 15 mins of research that I just did to question the basis of the story (and its underlying credibility).

  • kawasakiman

    I assume you are talking about houses in cloud cuckoo land ?


Property search
Browse by area

Latest from Independent journalists on Twitter